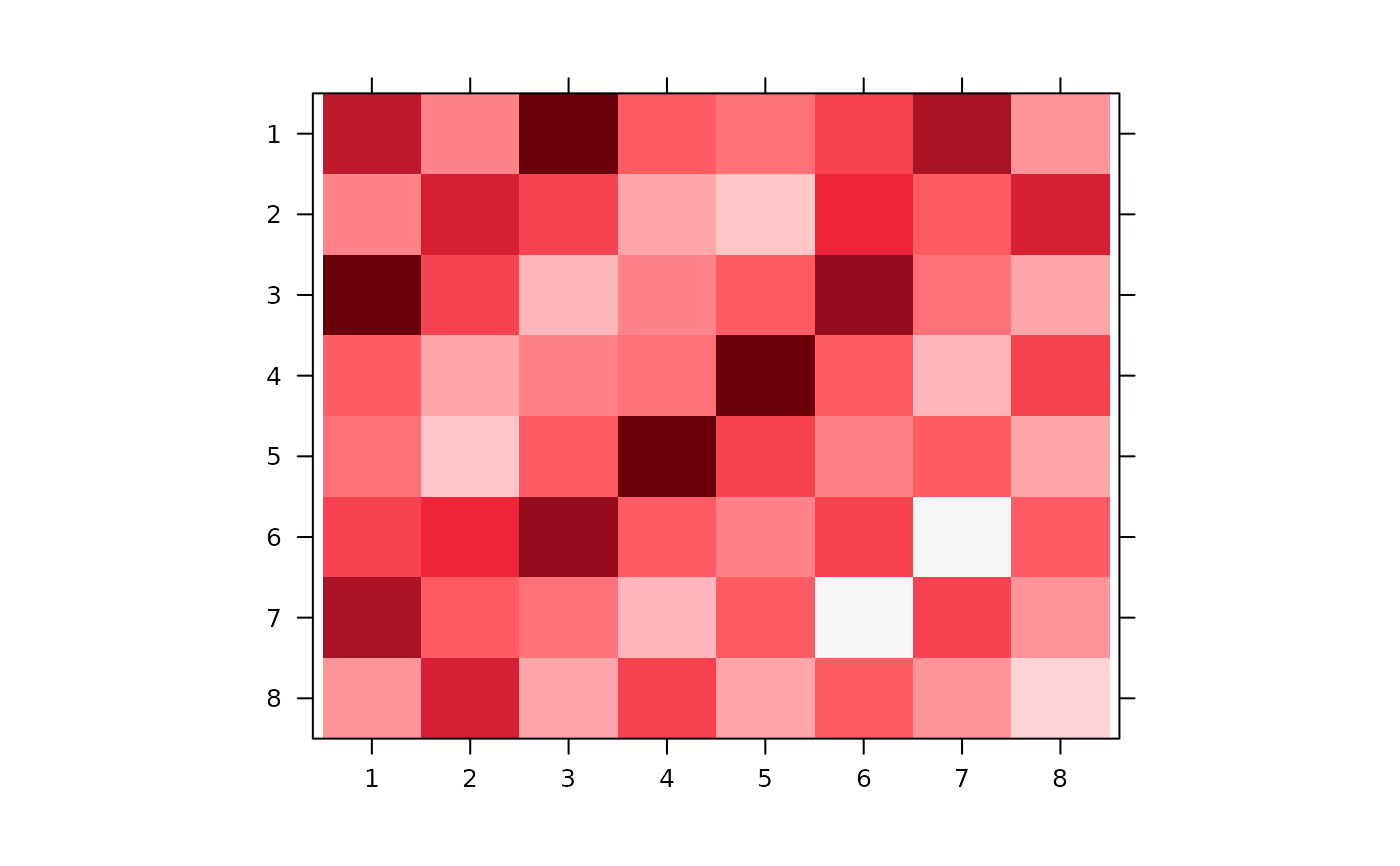
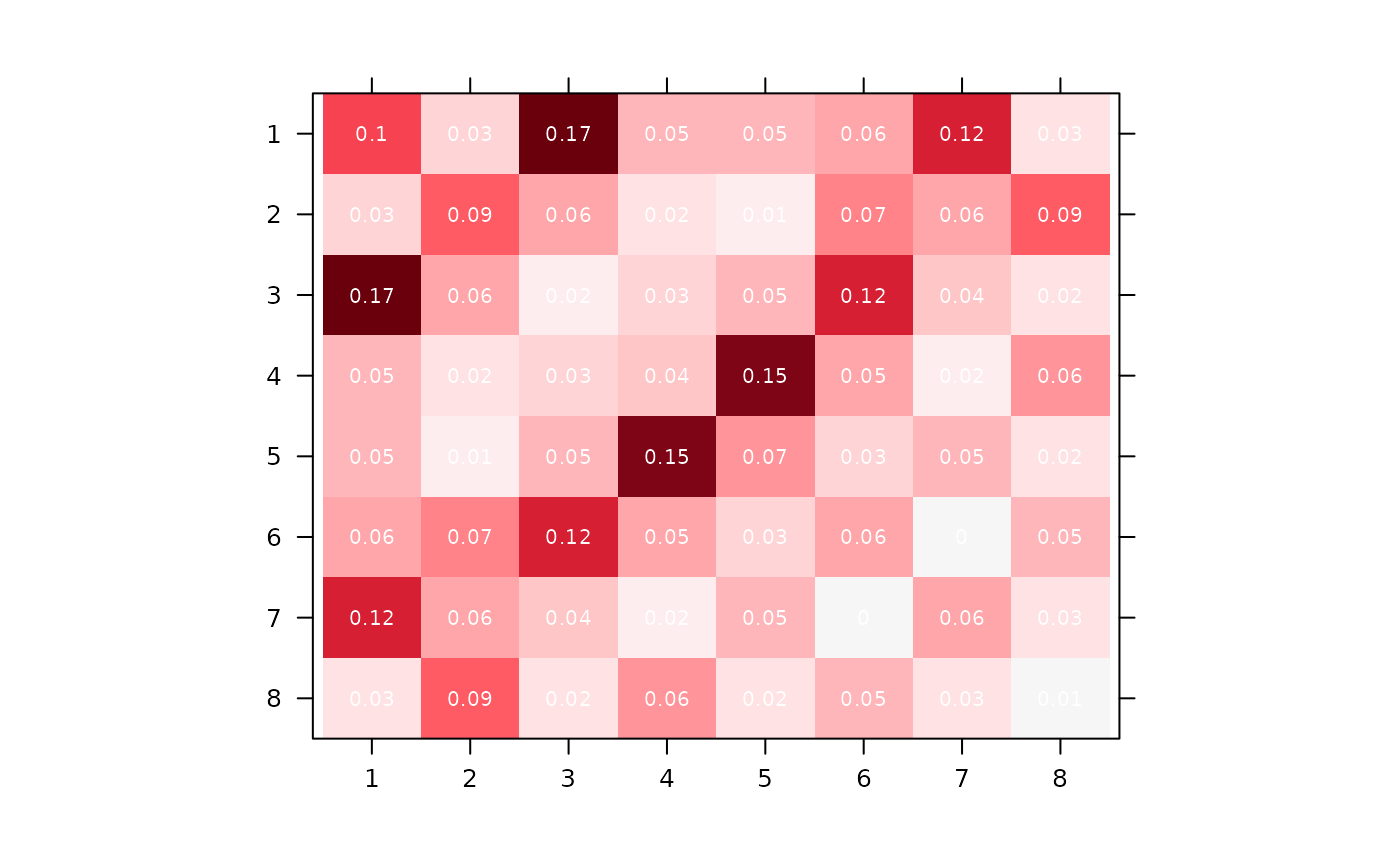
Network histogram plot
plot.nethist.RdDrawing lattice::levelplot() using a nethist object.
Usage
# S3 method for class 'nethist'
plot(
  x,
  type = "nethist",
  idx_order = 1:max(x$cluster),
  power = 0.25,
  col.regions = function(n) grDevices::hcl.colors(n, palette = "Reds 3", rev = TRUE),
  colorkey = FALSE,
  prob = FALSE,
  digits = 2,
  prob.cex = 0.1 + 0.5/log10(max(x$cluster)),
  prob.col = "white",
  at = NULL,
  y = NA,
  ...
)
Arguments
- x
a nethist object from
nethist().- type
One of
nethist(default) orprob."pmat"is a deprecated alias for"prob".- idx_order
A numeric vector for index label order, which must be a permutation of
x$cluster. IfNA, it uses1:max(x$cluster).- power
A positive number for the power transform applied to the graphon estimate. Only used when
type = "nethist". Default is0.25.- col.regions
A function taking an integer
nand returningncolors. Default is viridis viagrDevices::hcl.colors().- colorkey
Logical. Whether to draw a color legend. Default
FALSE.- prob
Logical. Whether to print block probabilities on the plot. Default
FALSE.- digits
Integer. Number of decimal places for probabilities.
- prob.cex
Numeric.
cexfor probability labels.- prob.col
Color for probability labels. Default
"white".- at
A numeric vector of breakpoints for the color scale. If
NULL(default), breakpoints are computed automatically from the data range. Specify a fixed vector to compare plots from different fits on a common scale.- y
A dummy variable for S3 dispatch. Never used.
- ...
Additional arguments passed to
lattice::levelplot().