
Plot an hnethist object
plot.hnethist.RdPlots a heatmap or a BIC curve for an hnethist object.
Usage
# S3 method for class 'hnethist'
plot(x, type = "nethist", at = NULL, ...)
Arguments
- x
an
hnethistobject fromhnethist().- type
One of
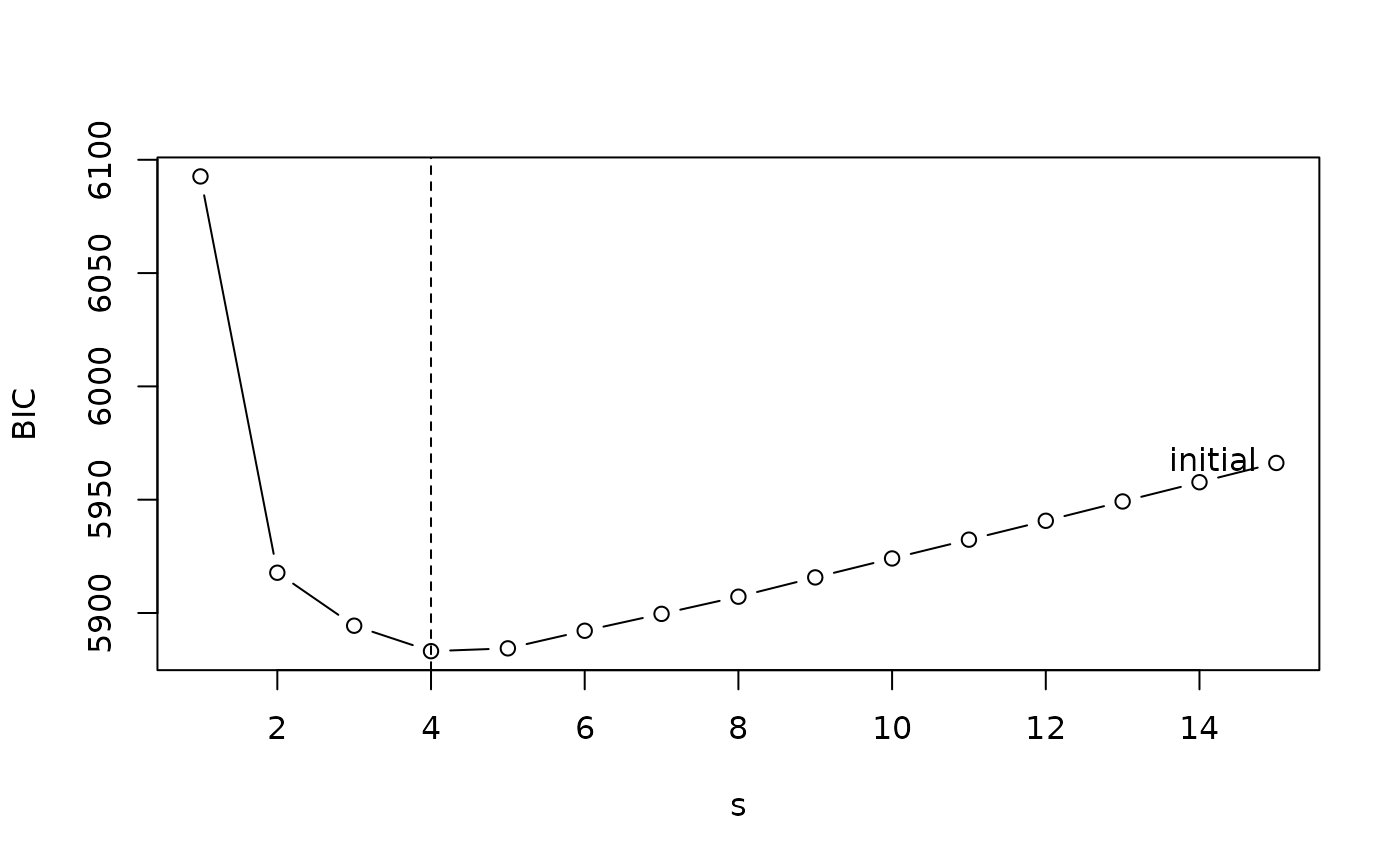
nethist(default),prob, orBIC. Whentype = "BIC", plots BIC values against the number of shapess. The selected model is marked with a dashed vertical line, and the rightmost point (largests, corresponding to the initial nethist fit) is labelled.type = "bic"is also accepted.- at
A numeric vector of breakpoints for the color scale. Passed to
plot.nethist(). Seeplot.nethist()for details.- ...
Additional arguments passed to
plot()whentype = "BIC", or toplot.nethist()otherwise.
Examples
# \donttest{
set.seed(2022)
A <- igraph::as_adjacency_matrix(
igraph::sample_gnp(100, 0.3), sparse = FALSE)
fit <- suppressMessages(hnethist(A))
plot(fit)
 plot(fit, type = "BIC")
 # }
# }