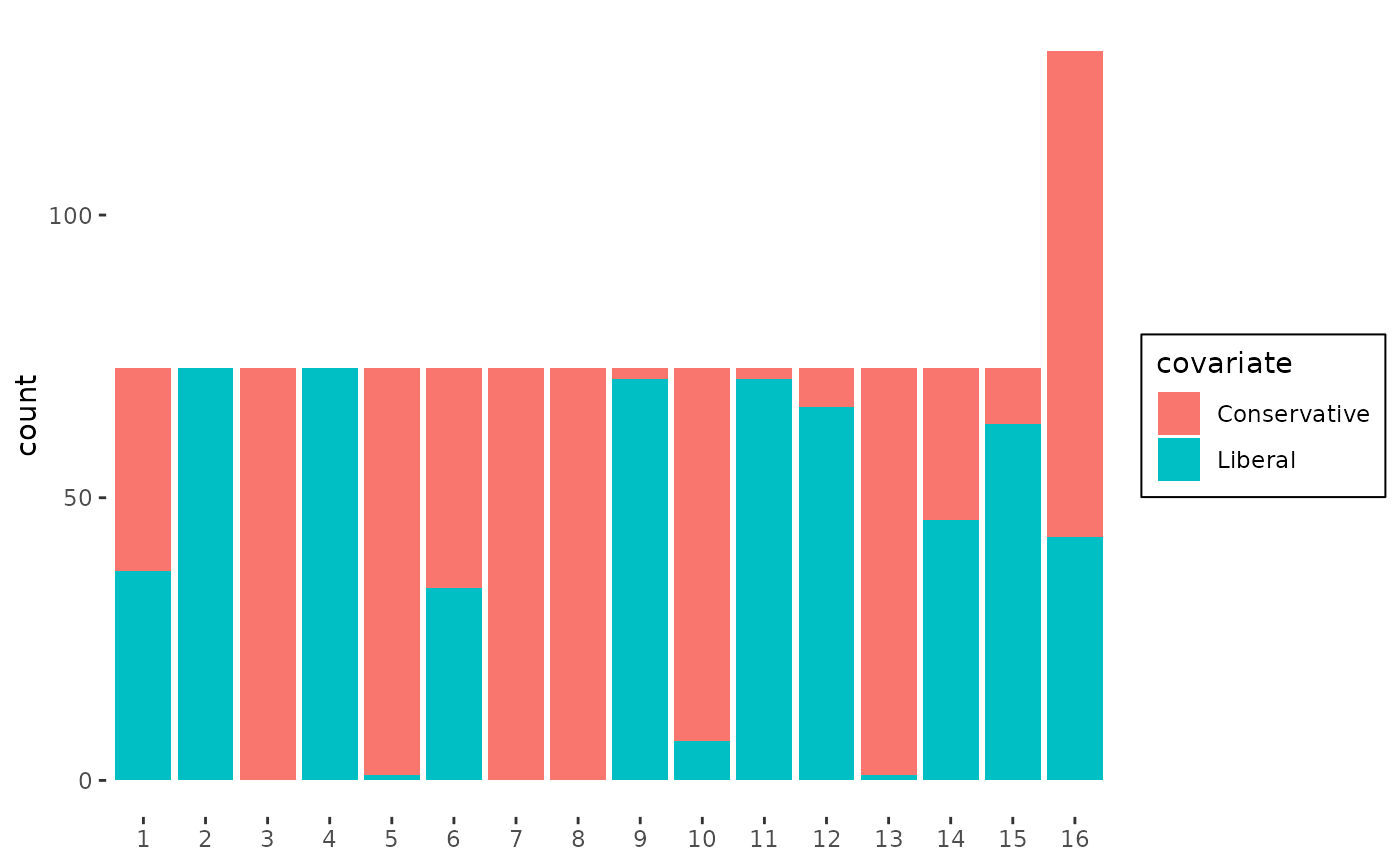
Bin summary by covariate
covariate_plot.RdDrawing a bin summary plot of covariates given a multinethist object with a user-specified order.
Usage
covariate_plot(
  object,
  covariate,
  idx_order = 1:max(object$cluster),
  main = NA,
  xlab = NULL,
  ylab = NA,
  legend_title = NA,
  stat = "count",
  position = "stack"
)

summary_plot(object, covariate, ...)
Arguments
- object
a
multinethistobject frommultinethist().- covariate
a vector for univariate covariate. If it is a factor, a stacked bar chart is drawn. If it is numeric, a violin plot is drawn.
- idx_order
A numeric vector for index label order, which must be a permutation of
object$cluster. IfNA, it uses1:max(object$cluster).- main
title of summary plot. If NA, the plot has no title.
- xlab
label of x-axis. If
NULL, no label is shown.- ylab
label of y-axis. If NA, y-axis label is "covariate"
- legend_title
title of legend. If NA, the legend title is "covariate"
- stat
variables pass to
ggplot2::geom_bar(). Only used for a factor covariate.- position
variables pass to
ggplot2::geom_bar(). Only used for a factor covariate.- ...
currently unused.